Data Viewer
Brief Introduction
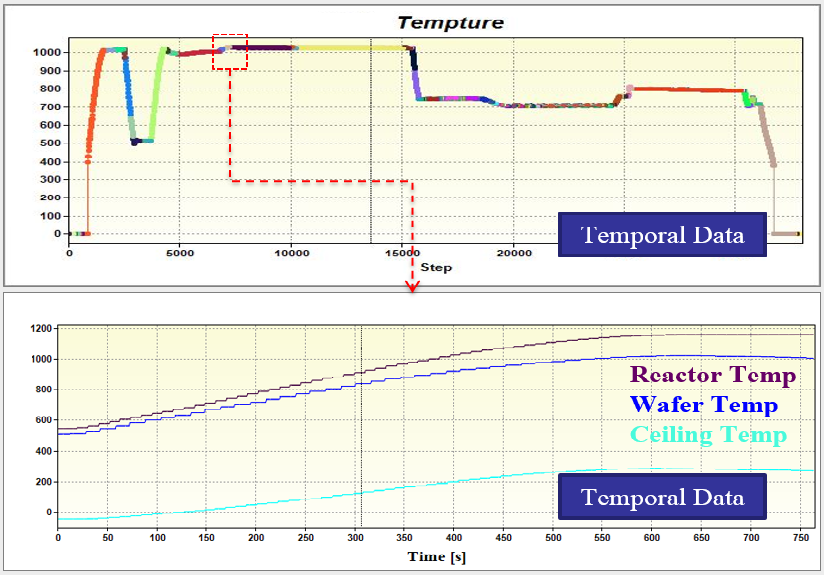
Graphical display system to visualize the factories, machine or process information.
Features and Functions
Provide graphical displays and comparisons of machine tool data and graphics editing with the clear process step segmentation
Output the temporal data and average data of analyzed parameters (cross-tool, cross-recipe, and cross-step)
Graphical curve can be moved horizontally to facilitate the comparison.
New Features and Functions in R2019b
All interface is updated to web-based. The limitation of the operation platform is eliminated, user can query and compare the process parameter visualization through the browser directly.
Benefits
Providing an important way for the graphical display of process data and establishing the basis for parameter analysis
Integrate machine parameter information, break the limit of Machine, Recipe and Step, quickly compare the difference between the process